Table of Contents
ToggleIntroduction
Monitoring performance is no longer an option in the complex, distributed, and cloud-native environments today, but a requirement. What is OpenTelemetry (OTel)? It is an open source observability framework that harmonizes the way logs, metrics, and traces are gathered, transmitted, and processed. OpenTelemetry provides the ability to have uniform visibility across applications and infrastructure across platforms and vendors by standardizing these elements.
OpenTelemetry (OTel) is important because it can be used to bring about interoperability. It is also not proprietary like the proprietary tools of monitoring because it does not tie organizations to a single ecosystem. Rather, it establishes a platform upon which the telemetry data may be openly transferred to various locations. This provides an all-purpose observability criterion and scalable, portable, and future-ready monitoring.
If you are also exploring broader cloud computing concepts, OTel fits perfectly as the observability layer in that ecosystem.
Why Observability Needs a Standardized Approach
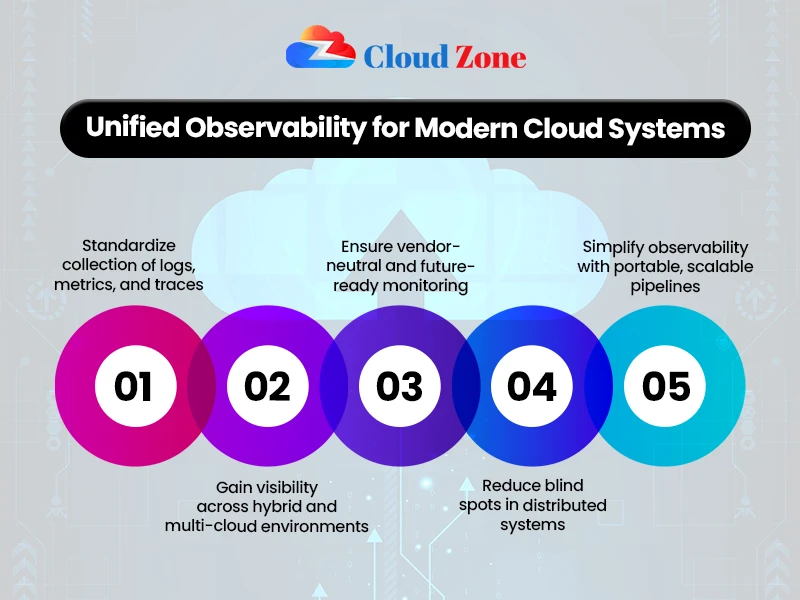
The current systems have micro services, containers, and server less workloads, which are frequently managed by a hybrid and multi-cloud environment. Classical methods of monitoring did not address this kind of complexity. They tended to monitor individual servers or applications, which created blind spots.
This issue is resolved with the introduction of OpenTelemetry metrics. Metrics are measurable metrics of performance like CPU consumption, request latency, or error rates. OpenTelemetry provides the compatibility of platforms and tools by standardizing the manner in which they are collected. This enables the teams to have comparative results on system behavior and detect bottlenecks in performance more quickly.
If you’d like to dive deeper into telemetry itself, OTel is one of the most practical implementations available today.
How Does OpenTelemetry Work?
- Application instrumentation OTel SDKs are available in several programming languages (Java, Python, or Go) and are often integrated with application designs.
- These SDKs gather telemetry data such as traces, metrics, and logs.
- The collected data are directed to the OpenTelemetry Collector, which is a vendor-neutral service that normalizes and processes the data.
- Then the telemetry is sent to monitoring back ends such as Prometheus, Jaeger, or commercial products by the exporters.
- Users can know the performance trends, dependencies, and anomalies at the system level.
OpenTelemetry Metrics: Why They Matter
Application monitoring relies on the OpenTelemetry metrics to follow its health. They are quantitative records of data that show the performance of systems over time. Key benefits include:
Consistency: The formats of all the applications are consistent.
Compatibility: Metrics is compatible with various cloud monitoring solutions.
Correlation: Metrics may be displayed together with traces and logs to gain further understanding.
Efficiency: Fewer overheads than custom-built metric collection.
These benefits allow the metrics of OpenTelemetry to enable teams to regress to reactive issue resolution, rather than proactive performance management.
This aligns with the cultural shift many companies experience when adopting a DevOps culture, where continuous feedback and observability are essential.
Monitor, trace, and optimize your applications instantly with our expert observability solutions.
OpenTelemetry vs Prometheus
| Feature | OpenTelemetry (OTel) | Prometheus |
| Primary Role | Standardizes the collection of traces, logs, and metrics | Time-series database and monitoring system |
| Scope | Data instrumentation and export layer | Metrics scraping, storage, and alerting |
| Data Types Supported | Metrics, traces, logs | Metrics only |
| Integration | Vendor-neutral, works with multiple backends | Typically used with Grafana or Alertmanager |
| Adoption Use Case | Cross-platform observability pipelines | Kubernetes and container monitoring |
| Complementary Role | Provides metrics to Prometheus for storage/analysis | Stores and queries metrics collected by OTel |
Does Dynatrace support OpenTelemetry?
If you are wondering, does Dynatrace support OpenTelemetry? The answer is yes. Dynatrace does not just accept OpenTelemetry traces, metrics, and logs but complements them with its high-performance AI-supported automation capabilities. It is both compatible with the OTel SDKs and Collector to offer vendor-neutral and standard observability.
Concisely, even when posing the question, does Dynatrace support OpenTelemetry? the objective response is yes, so it is a dependable option in providing end-to-end visibility in cloud-native, hybrid, and multi-cloud.
What is OpenTelemetry Used For?
- Monitoring micro services distributed in e-commerce.
- The latency of debugging financial applications.
- Gathering the performance indicators of SaaS platforms.
- Tracking requests in medical software to enhance reliability.
- Compliance in the form of supporting secure and reliable logs.
The Role of the OpenTelemetry Collector
- Getting telemetry information from various sources.
- It is processing, filtering, and batching it effectively.
- Simultaneously exporting data to different observability platforms.
- Reducing the overhead of the system, but preserving performance.
Centralize logs, traces, and metrics with expert guidance for enterprise-grade observability.
How OpenTelemetry Works in Real Environments
In addition to theory, practical examples of how OpenTelemetry works are eloquent on how valuable it can be:
E-commerce: Monitors checkout procedures in terms of inventory, payments, and shipping microservices.
Finance: Recognizes abnormalities in transaction processing and ensures adherence.
Healthcare: Tracks the patient portal responsiveness to enhance the digital care.
Telecom: The flows of requests are tracked over 5G infrastructure.
Government: Makes citizen digital services transparent.
Such situations demonstrate how this works is reflected in the quantifiable benefits in industries.
OTel is also relevant in mobile cloud computing architectures, where telemetry must be captured across devices and backend services seamlessly.
Industry-Specific Opportunities with OpenTelemetry
Telecommunications: 5G and edge network latency monitoring.
Gaming: Secures availability when there are massive multiplayer player games.
Energy: Maximizes grid distribution by telemetry analytics.
Retail: Follows the customer trails to enhance customization.
Education: Checks on learning sites on the internet.
As industries embrace Ubuntu cloud computing and open platforms, OTel strengthens observability in ways that are transparent and customizable.
OpenTelemetry and the Future of Observability
The future of OpenTelemetry (OTel) seems to be bright, as it is quickly becoming the observation language of choice. As distributed systems keep on becoming increasingly complex, the unified requirements of telemetry will only increase. The future innovations will be able to support logs, enhance their integration with AI-powered analytics, and make them fully compatible with compliance frameworks.
With the current rate of adoption, OTel will probably become a key component of proactive monitoring, and since its purpose is no longer to detect issues once they arise, but rather to predict and prevent them. This trend indicates that OpenTelemetry (OTel) is not a framework only, but a foundation of a new generation of digital reliability.
Organizations investing in best cloud storage for business or planning cloud backup solutions can benefit directly from OTel’s observability. Similarly, as enterprises develop cloud migration strategies, OTel ensures that performance insights are not lost during transitions.

Conclusion
So, what is OpenTelemetry (OTel)? It is an open-source, vendor-neutral standard that unifies how telemetry data is captured and shared across systems. Standardizing metrics, traces, and logs it ensures that organizations gain consistent visibility into complex environments.
From metrics of OpenTelemetry to the OpenTelemetry Collector, its ecosystem simplifies observability without sacrificing flexibility. The framework’s compatibility with Prometheus and integration into platforms like Dynatrace underscore its adaptability.
Ultimately, the value lies not in debating the differences but in recognizing how the two complement one another. As enterprises scale their digital transformation, OpenTelemetry will remain essential for ensuring reliability, compliance, and performance in modern systems.

Sukhamrit Kaur
Sukhamrit Kaur is an SEO writer who loves simplifying complex topics. She has helped companies like Data World, DataCamp, and Rask AI create engaging and informative content for their audiences. You can connect with her on LinkedIn.